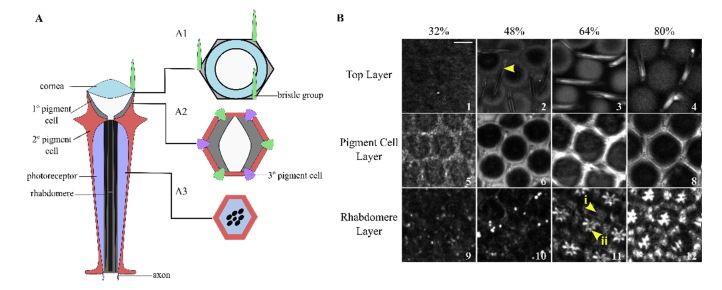
Fig. 1.
THG microscopy images of the developing retina during the pupal stage along with a schematic of an ommatidium. (A) A simplified schematic of a single ommatidium showing three focal depths of interest. (B) THG images at the three focal depths of interest (rows) at four stages of pupal development (columns, %). Images are normalized to excitation energy. The scale bar represents 10 µm.

