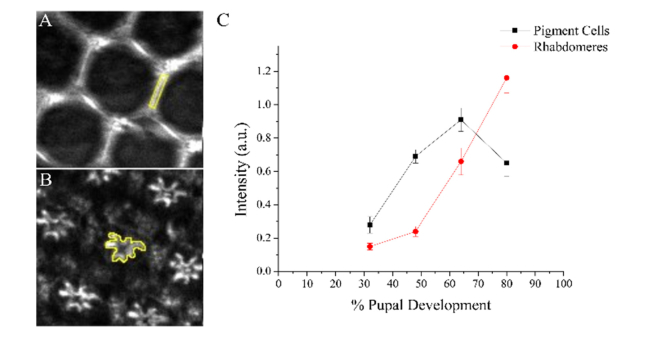
Fig. 2.
A method to measure the localized THG intensity, and corresponding THG intensity-dependent curve for w1118 pupal retinas. The THG localized in either the pigment cells (A) or in the rhabdomeres (B) were measured. (C) The resulting THG intensity graph shows changes in THG intensities of the pigment cells and the rhabdomeres during pupal development. Highlighted regions in (A) and (B) are used to calculate the THG intensities. Error bars represent standard error of the average THG intensity measured from 11 pupae.

