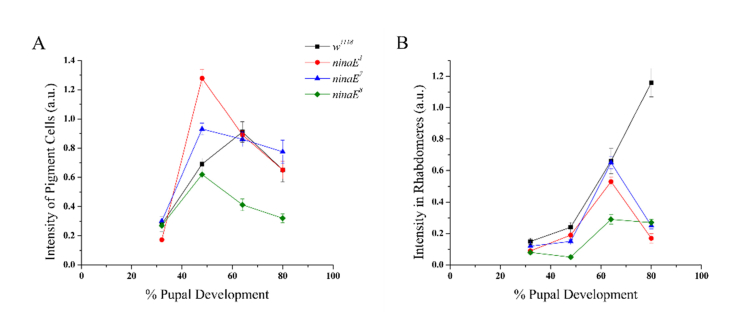
Fig. 6.
Comparison of THG intensities between ninaE mutants and the control pupal retinas. (A) THG intensities localized in the pigment cells of each mutant were shown to produce a different curve compared to the wild type. (B) THG intensities localized in the rhabdomeres in each mutant were found to have a similar curve as the wild type until 64% pd.

