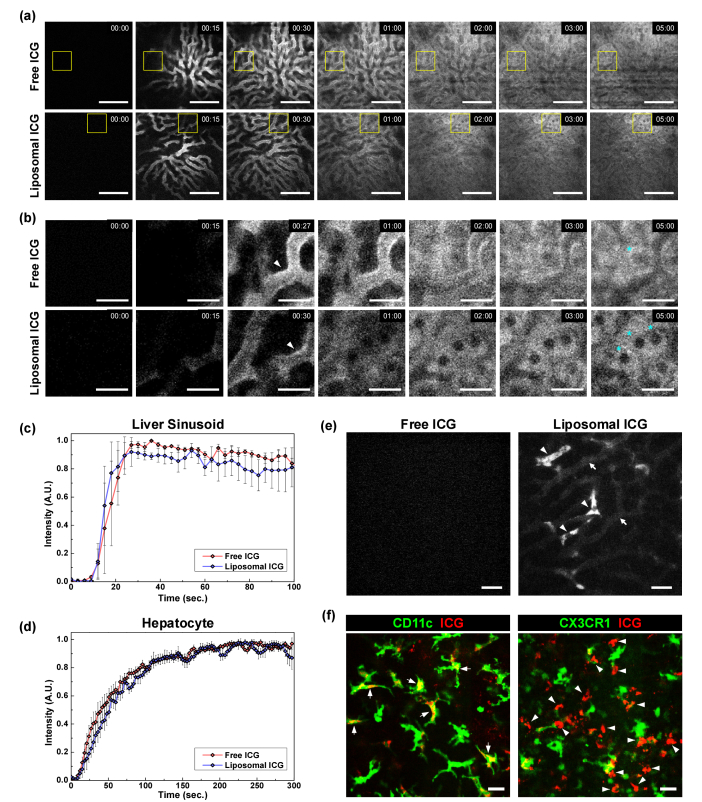
Fig. 3.
(a) Representative sequential images of the liver of the mouse after intravenous injection of free-form or liposomal ICG, (Visualization 3 (5.1MB, MOV) and Visualization 4 (5.3MB, MOV) ). (b) Magnified sequential images at the area marked by yellow square in (a), (Visualization 5 (5.2MB, MOV) and Visualization 6 (5.2MB, MOV) ). (c, d) Relative fluorescence intensity in (c) liver sinusoid and (d) hepatocyte. (e) Images obtained at the liver at 12 hours after the intravenous injection of free-form and liposomal ICG. No fluorescence signal was observed in the liver of mouse received the free-form ICG injection. In the liver of mouse received liposomal ICG injection, fluorescence signal was observed in sinusoid (arrow) and Kupffer cell (arrowhead). (f) Images obtained at the liver of CD11c-YFP and CX3CR1-GFP mouse at 24 hours after intravenous injection of liposomal ICG. Scale bar: (a) 100 μm, (b, e-f), 25 μm.

