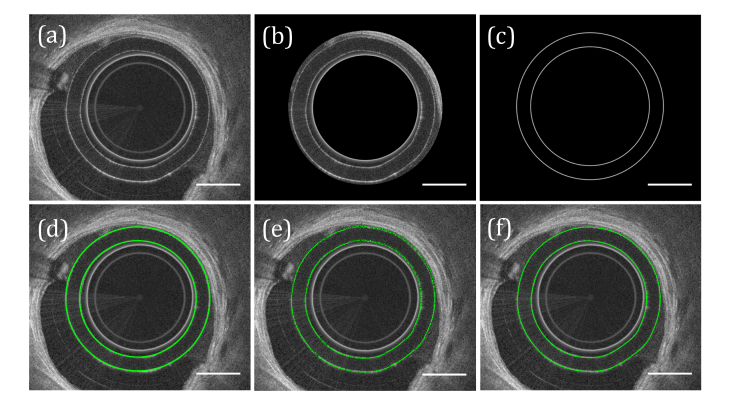
Fig. 2.
Segmentation of catheter sheath. (a) Input image. (b) Approximate location of sheath segmented based on known sheath dimensions. (c) Artificial sheath signal. (d) Position of maximum cross-correlation of artificial sheath signal with segmented image from (b). (e) Sheath fit after minor adjustments made based on image intensity. (f) Final sheath fit, after applying a smoothing filter to (e). In this figure the circularization offset has been artificially increased and the images cropped to make the figure clearer, and the scale bar was determined relative to the outer surface of the sheath. Scale bars, 0.5 mm.

