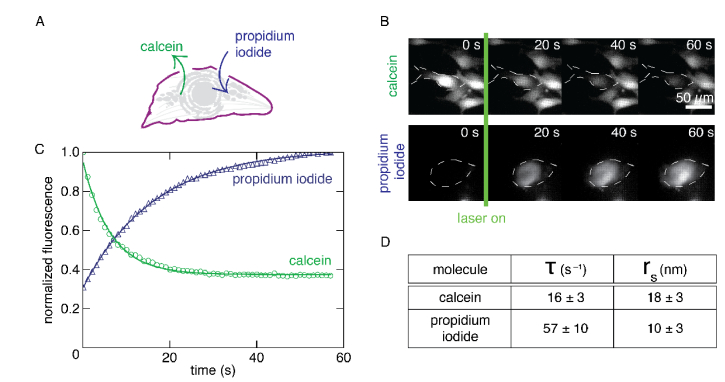
Fig. 2.
Determining the pore size using time-lapse imaging.(A)Calcein outflow and propidium iodide inflow. (B) Time-lapse imaging of C2C12 cells to determine the decrease in fluorescence over time at 10 frames per second (fps) for 60 s. Outlines of cells show the region in which fluorescence signal is measured. (C) Relative fluorescence of calcein and propidium iodide over time. The data is fitted to Eq. (2). (D) Data showing in/outflow exponential constants and a pore radius rs of 18.4 ± 2.9 nm with calcein and 9.7 ± 3.4 nm with Propidium Iodide. Numbers obtained from three independent experiments, using five cells for each experiment.

