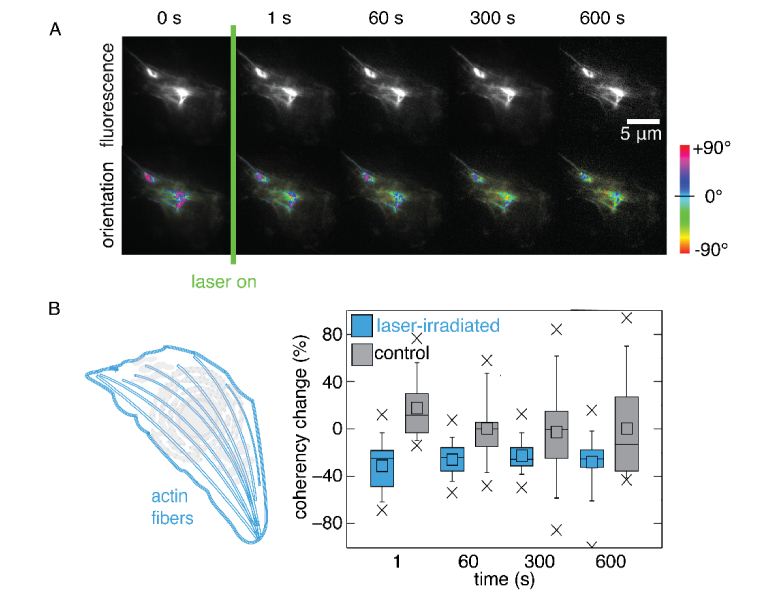
Fig. 5.
Cytoskeleton orientation.(A) Fluorescent imaging of the cytoskeleton before and after laser exposure and calculated fiber orientation of fibers in the cytoskeleton. (B) Change in fiber orientation over time. Boxes represent the 25% and 75% quantile and whiskers represent the 5% and 95% quantile. The straight line across the box represents median and small square box represents mean. Crosses represent minimum and maximum in each data set. Data obtained from three independent experiments, with 10 cells each; p-values all greater than 0.05.

