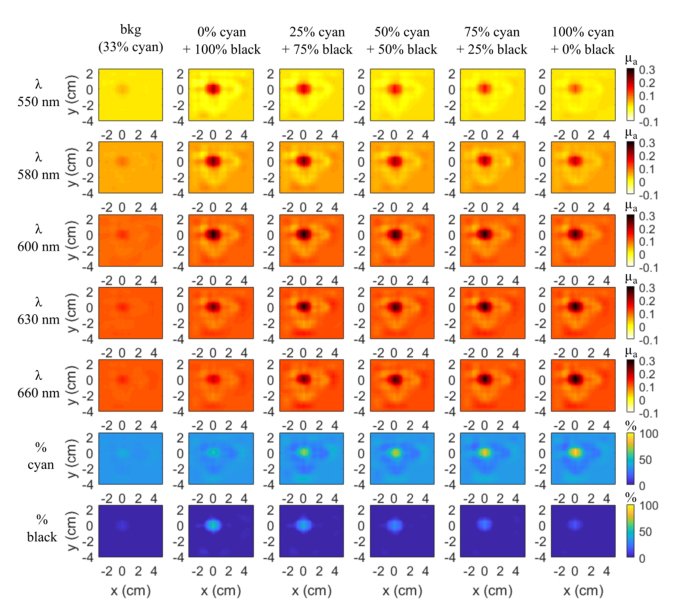
Fig. 2.
Slices y-x (z = 10 mm) of 3D reconstruction μa maps of each balloon inclusion at each wavelength at 10 mm depth and the chromophore decomposition in percent of cyan and black inks solutions by taking into account the 5 wavelengths (550-580-600-630-660 nm) (rows 6-7). Same colorbar for each line.

