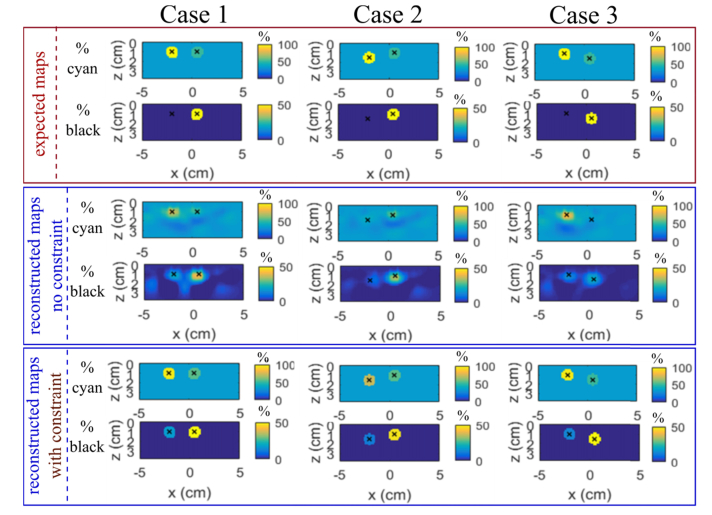
Fig. 7.
Slices z-y of 3D chromophore decomposition in percent of cyan and black inks of the multi-inclusions phantoms Case 1, 2 and 3 defined in Table 1 with the optimal wavelength combination (550, 580 and 600 nm). Rows 1-2 the expected values, rows 3-4 reconstructed maps with the standard reconstruction and rows 5-6 with the spatially constrained method. The black crosses correspond to the expected center of the inclusions.

