
Figure 1.
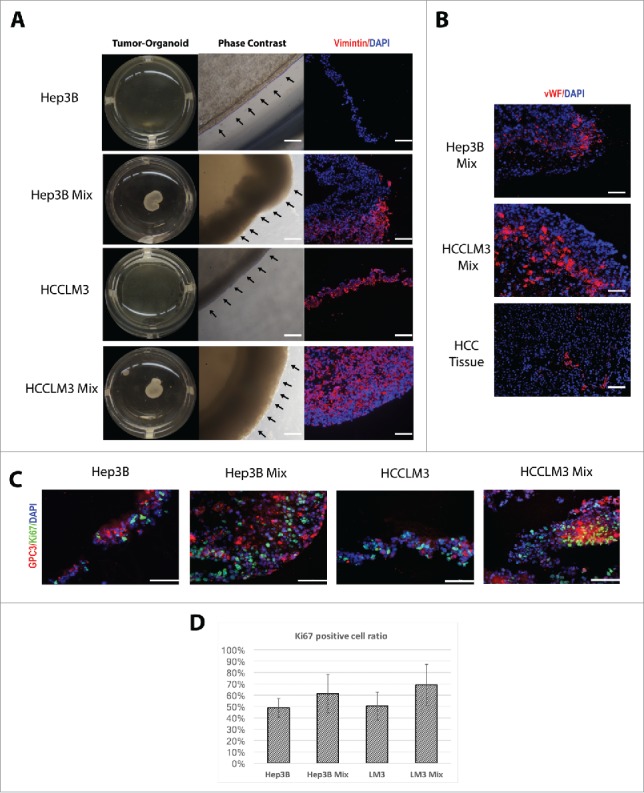
Self-assembly of tumor-organoids and proliferation assay. (A) Phase contrast microscopy of tumor-organoid in a 24-well culture plate. Time-lapse of HCC cells and human non-parenchymal cells (fibroblast and endothelial cells) or only HCC cells cultured on matrigel at 24h. Immunofluorescence analysis of the resulting tumor-organoids, Vimentin; red, nuclei; blue. Scale bar 100 µm. (B) Immunofluorescence stainings of endothelial cells in 2 mixed cells tumor-organoids and human HCC tissue, vWF; red, nuclei; blue. Scale bar 100 µm. (C) Proliferation analysis by Ki67 immunefluorescence staining, GPC-3; red, nuclei; blue, Ki67; green. Scale bar 200 µm. (n = 3) (D) Ki67-GPC3 positive cell quantification (n = 3).