
Figure 2.
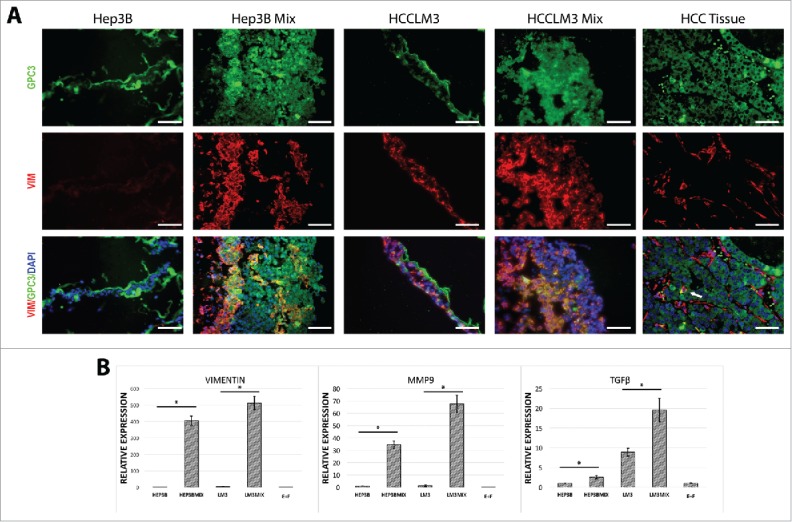
Characterization of tumor-organoids for epithelial-mesenchymal transition associated markers. (A) Immunofluorescence analysis of the resulting tumor-organoids and human HCC tissue, white arrow; strong double positive cells in human HCC tissue, GPC-3; green, nuclei; blue, vimentin; red. Scale bar 200 µm. (n = 3). (B) Quantitative PCR analysis of Vimentin, MMP9 and TGFβ in human tumor-organoids and controls at 24 h after self-assembly. Results represent mean ± s.d., (n = 3) * p < 0.05.