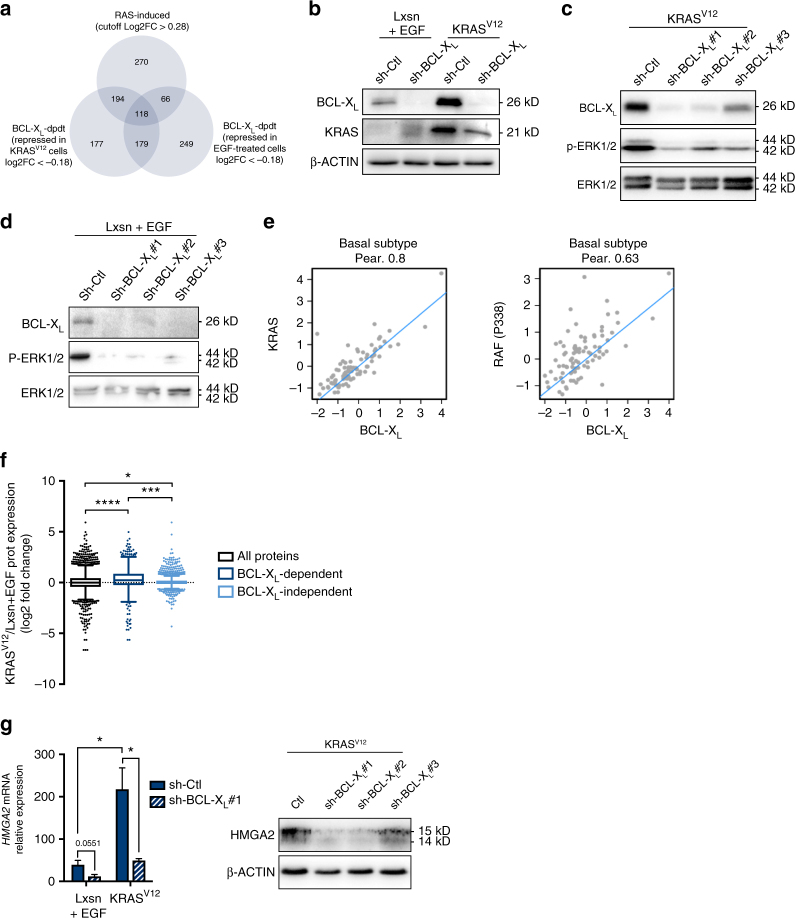
Fig. 3.
BCL-XL contributes to MAPK activation to induce HMGA2 expression. a Venn diagram of repartition of protein expression variations in iTraq experiment. Applied cut-offs on log2 Fold Change are mentioned for each condition. RAS-induced proteins are those for which the log2 Fold Change is higher than 0.28 in MCF10A KRASV12 sh-Ctl compared to MCF10A Lxsn sh-Ctl. BCL-XL-dpdt proteins are those for which the Log2 fold change is lower than −0.18 in sh-BCL-XL compared to sh-Ctl in either EGF-treated MCF10A Lxsn cells (right) or MCF10A KRASV12 cells (left). b–d Western blot showing KRAS, BCL-XL and/or p-ERK expressions in b MCF10A Lxsn and KRASV12 cells, c MCF10A KRASV12 cells 72 h after sh-BCL-XL and d MCF10A Lxsn cells 72 h after sh-BCL-XL (in presence of 20 ng ml−1 EGF in MCF10A Lxsn media). e Correlations between BCL-XL protein expression and KRAS protein expression (left) or p338RAF protein expression (right) in basal subtype tumour samples. Quantified expression of BCL-XL, KRAS and p338RAF from RPPA data were examined for correlation using Pearson’s (Pear.) analysis. The results shown here are based upon data generated by the TCGA Research Network: http://cancergenome.nih.gov/. f Box & Whiskers representation of KRASV12 vs. Lxsn log2 Fold Change protein expression (Tukey representation, unpaired t-test with equal SD). Black box represents log2FC for all proteins, dark blue box represents KRAS vs. Lxsn log2FC of BCL-XL-dependent proteins (as defined above), light blue box represents KRAS vs. Lxsn log2FC of BCL-XL-independent proteins (with sh-BCL-XL vs. sh-Ctl log2FC <−0.18 or >0.18 in KRASV12 background). g qPCR analysis of HMGA2 mRNA in MCF10A Lxsn and KRASV12 cell lines infected with sh-BCL-XL during 72 h (in presence of 20 ng ml−1 EGF in MCF10A Lxsn media). Mean and SEM of 3 independent experiments are represented as relative quantity of mRNA normalised to the mean of RPLP0, RPS18 and GAPDH relative expression (two-tailed unpaired t-test). Western blot analysis showing HMGA2 expression in MCF10A Lxsn cell line infected with sh-BCL-XL during 72 h

