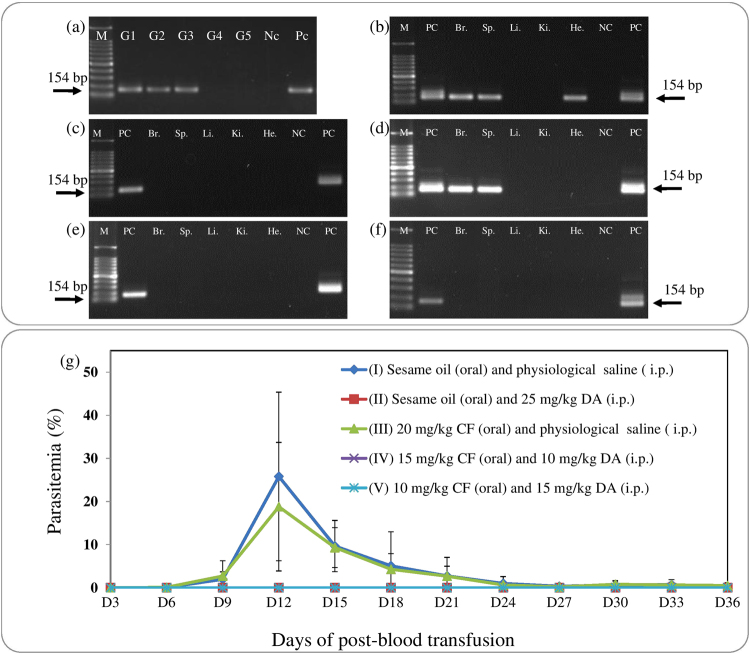
Figure 3.
PCR detection of B. microti from CF‒ or DA‒treated mice on day 52 post-infection. (a) in blood DNA samples: G1, untreated; G2, 25 mg/kg DA; G3, 20 mg/kg CF; G4, 15 mg/kg CF and 10 mg/kg DA combination; G5, 10 mg/kg CF and 15 mg/kg DA combination. (b–f) in tissue DNA samples: M, 100 bp size marker; PC, positive control; Br., brain; Sp., spleen; Li., liver; Ki., kidney; He., heart, NC, negative control. The double bands observed with some of the positive controls represent amplicons of the first and second PCR. Only a single band was observed when the concentration of template DNA was reduced (data not shown). (g) Infectivity of B. microti in RBC-transfused mice. Parasitemia was calculated by counting infected RBCs among 500 RBCs.

