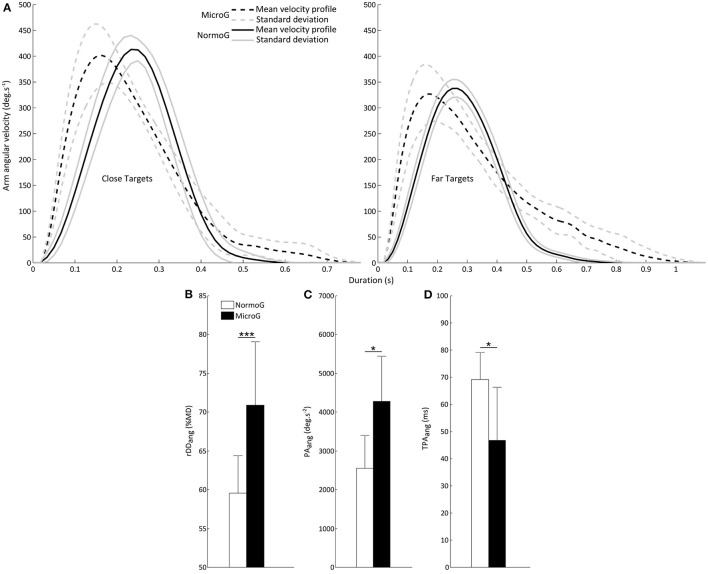
Figure 3.
(A) Representative mean arm angular velocity profiles for a typical subject in MicroG (dotted line) and NormoG (solid line) for the Close and Far targets. Gray lines represent the positive and negative standard deviations of the mean arm angular velocities. (B) Mean relative angular deceleration duration (rDDang) as a function of Environment. (C) Mean peak angular acceleration (PAang) and (D) Mean time to peak angular acceleration (TPAang) as a function of Environment. Error bars represent standard deviation of the mean. ***p < 0.001; *p < 0.05.

