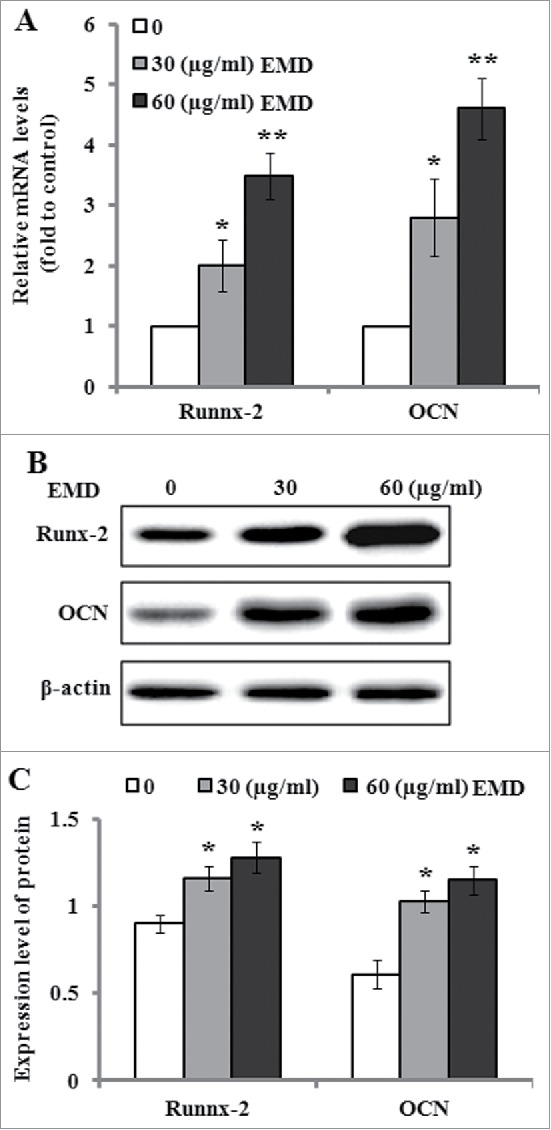
Figure 5.

Effects of EMD on the expression levels of Runx-2 and OCN. (A) The relative mRNA level of Runx-2 and OCN in the PDLSCs was detected by real time PCR after 14 d of induction culture containing 30 and 60 µg/ml of EMD. (B) Representative western blot images for the expression of Runx-7 and OCN in the PDLSCs after 14 d of osteogenic induction containing 30 and 60 µg/ml of EMD. (C) Relative protein level of Runx-2 and OCN were quantified by the densitometry of each band and normalized to β-actin signal. *P < 0.05 vs. the control.
