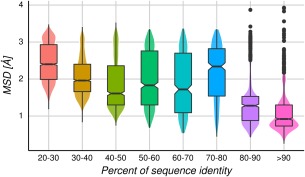
Figure 2.

MSD distributions over all homologous protein pairs by bins of 10% sequence identity. Above and below the median (horizontal line inside each box) are the first and third quartiles, respectively. The notches display the median absolute deviation.
