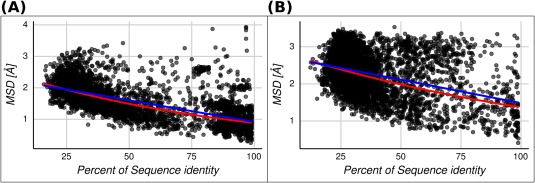
Figure 7.

MSD versus percent of sequence identity for each homologous protein pair. The lineal (blue line) and exponential (red line) regressions are shown for two sets. (A) Homologous protein pairs containing just ordered conformers. The linear and exponential fitted expressions are and , respectively. (B) Homologous protein pairs with at least one of the conformers containing disordered regions. The linear and exponential fitted expressions are and , respectively.
