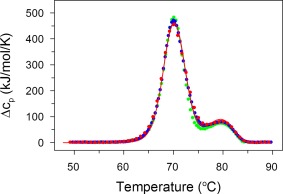
Figure 1.

DSC reveals that thermal transitions are concentration‐independent: IgG6B3 at concentrations of 0.5 mg/ml (green), 5.0 (blue), and 15.0 mg/ml (red) in PBS pH 7.4 were recorded at a scan rate of 0.5 K/min. Experimental data (every forth point) are shown as symbols and the fits according to the kinetic model described by Eq. (4) are shown as solid lines
