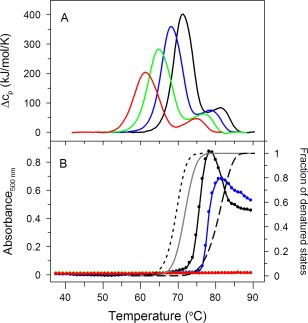
Figure 2.

(A) Effect of increasing urea concentration (0 M—black solid line, 1 M—blue solid line, 2 M—green solid line, and 3 M—red solid line) on DSC transitions, and (B) light scattering of IgG6B3 as a function of temperature. The addition of urea follows the same color code as in (A). Addition of urea can be seen to delay or completely prevent aggregation. Using the model of eq. 4 (derived in Sedlak et al.13) the molar fraction of either the U + D+F states (dotted black line), the D + F states (gray solid line), or just the F state (dashed black line) as a function of temperatures are also shown. No correlation is apparent between the onset of IgG6B3 aggregation (black line with symbols, absence of urea) and the temperature dependence of the molar fraction of any particular domain. DSC scans as well as light scattering experiments were performed with an IgG6B3 concentration of 0.75 mg/ml (5 μM) in PBS at pH 7.4 and a scan rate of 1.0 K/min
