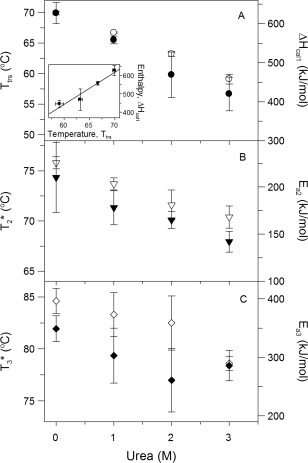
Figure 3.

Effect of urea concentration (0, 1, 2, and 3 M) on DSC transition temperatures (black symbols) and enthalpies (white symbols) of IgG6B3, according to the kinetic model described by Eq. (4). In panel A, the inset shows the calorimetric enthalpy of the first (reversible) transition as a function of transition temperature at the studied urea concentration. The line represents a linear fit (correlation coefficient R = 0.9678). DSC scans were performed with an IgG6B3 concentration of 0.75 mg/ml (5 μM) in PBS pH 7.4 and a scan rate of 1.0 K/min
