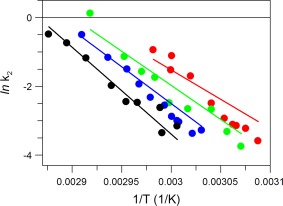
Figure 5.

Dependence of the rate constants of ANS binding to IgG as a function of temperature (shown as symbols) at different urea concentrations (indicated by color): 0 M (black), 1 M (blue), 2 M (green), and 3 M (red). Note that the lines are not the fit to the shown experimental data but depict the k 2 values derived from independent DSC measurements as a function of temperature, obtained from Eq. (5), describing the first irreversible step in IgG thermal unfolding in Eq. (4). The buffer was PBS at pH 7.4.
