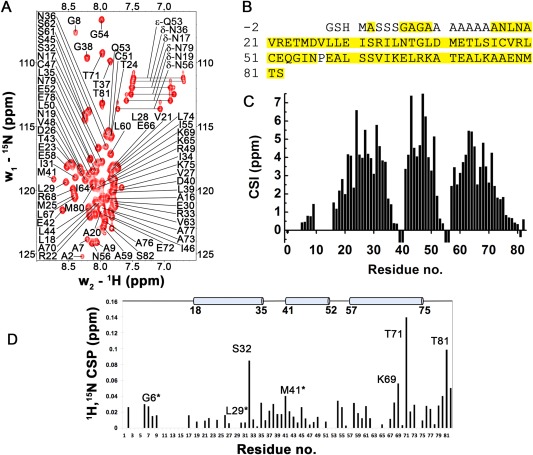
Figure 4.

Resonance assignment and NMR secondary structure of MOZART1 protein. (A) Assigned 15N‐BEST‐HSQC spectrum of MOZART1 protein recorded at 37°C and 600 MHz Larmor frequency. (B) Primary sequence of MOZART1 protein with residues for which backbone amide resonances were assigned highlighted in yellow. (C) Chemical shift index (CSI = (δ C α ,MOZART1 − δ C α ,random coil) − (δ C β ,MOZART1 − δ C β ,random coil)). Random coil values were taken from Wishart et al.45 The positive (CSI > 1.5) values indicate clearly three well‐defined α‐helical regions in solution. (D) Chemical shift perturbation (CSP) of MOZART1 upon addition of the GCP3(1–250) fusion protein. The CSPs of MOZART1 are plotted versus residue numbers with positions of helices as determined by NMR indicated on top. The residues that display chemical shift changes or whose NMR signals are significantly broadened upon titration with GCP3 are labeled. Stars indicate residues displaying signal broadening (until the limit of detection in the case of L29).
