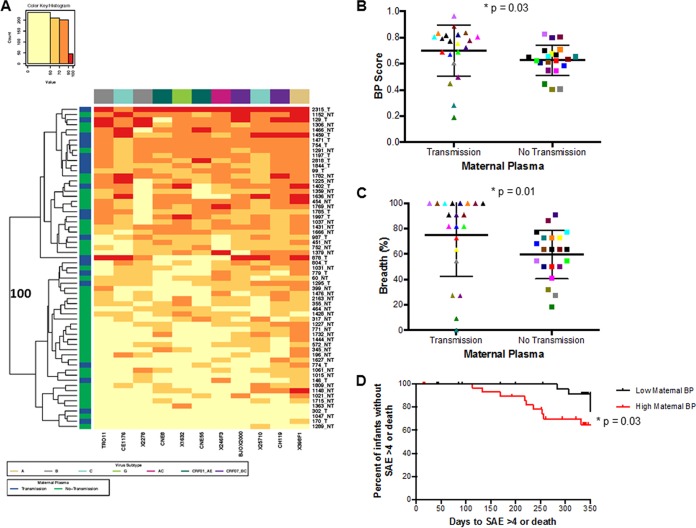
FIG 3 .
Maternal neutralization response against a heterologous global Env panel. (A) Each square in the grid represents the average percentage of neutralization for each virus-plasma combination tested: <50%, yellow; 50 to 70%, light orange; 70 to 90%, dark orange; >90%, red. Virus subtypes are indicated by color: A, khaki; B, gray; C, turquoise; G, lime green; AC, pink; CRF01_AE, dark green; and CRF07_BC, purple. On the left, blue denotes transmitting mothers (TMs) and green denotes nontransmitting mothers (NTMs). The branches show the hierarchical clustering with bootstrap probability for 100 iterations. (B and C) Comparison of (B) breadth and potency score (BP) and (C) breadth alone between TMs and NTMs. Colors signify matched pairs. Each dot represents an average value from a minimum of 2 independent neutralization experiments. (D) Kaplan-Meir curve estimating time (days) to a grade 4 SAE or death for infants born to mothers with BP greater than or equal to the cohort median (red) or less than the cohort median (black).

