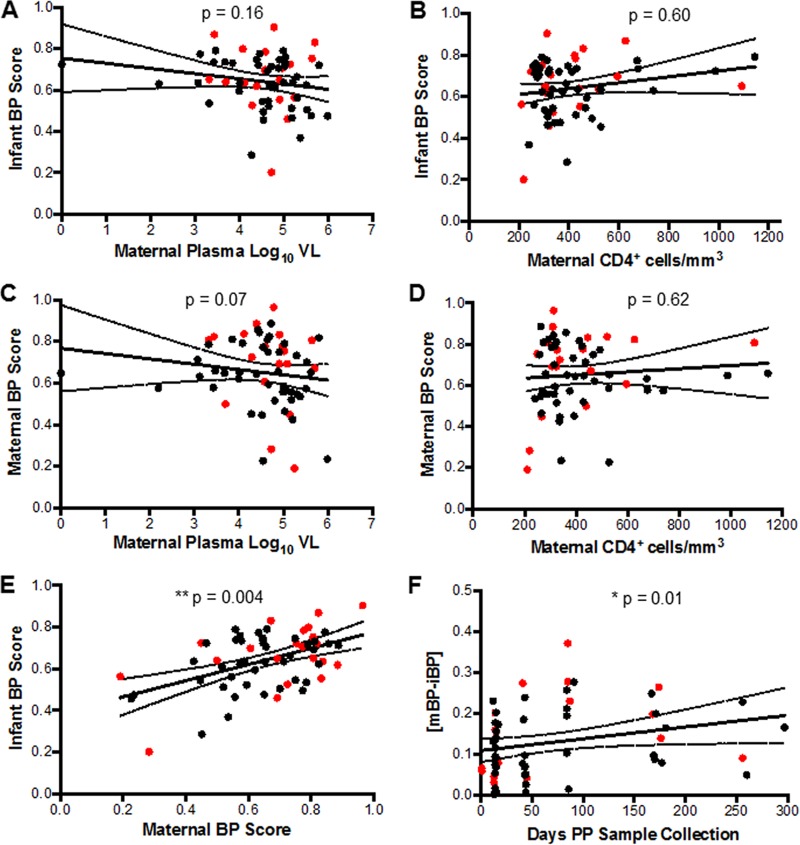
FIG 4 .
Infant and maternal BP score correlations. (A to F) Correlation between (A) infant BP score and maternal plasma virus level, (B) infant BP score and maternal CD4+ T-cell counts, (C) maternal BP scores and maternal plasma virus level, (D) maternal BP scores and maternal CD4+ T-cell counts, (E) infant and maternal BP scores, and (F) difference between maternal and infant BP scores and interval duration between birth and sample collection. The red dots indicate TMs and their AI infants. The black dots indicate NTMs and their HEU infants.

