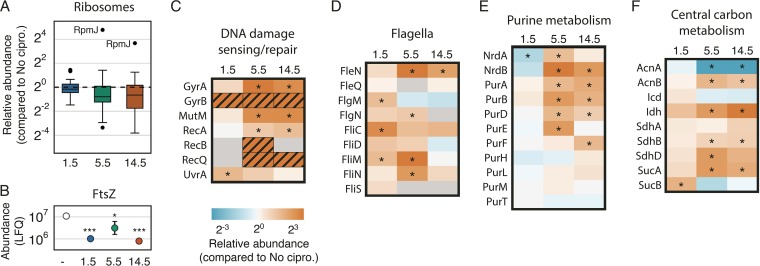
FIG 4 .
Dynamic cellular responses to ciprofloxacin. (A) Box plots showing the distribution of ribosomal protein abundances for treated samples compared to the untreated control. Each box indicates the second and third quartiles, and whiskers indicate the rest of the distribution. Values exceeding 1.5 times the interquartile range are displayed as points. The nonessential ribosomal protein RpmJ is indicated. (B) Abundance of FtsZ in each sample (mean ± standard deviation; n = 3; FDR adjusted P values are designated: *, P < 0.05; ***, P < 0.001). (C to F) Heat maps indicating the median abundance ratio for each time point compared to the untreated control for proteins involved in DNA damage sensing and repair (C), flagellum synthesis (D), purine metabolism (E), and central carbon metabolism (F). *, P < 0.05 (FDR-adjusted P value). The color scale for abundance ratios is shown under panel C. Gray boxes indicate time points for which that protein was not quantitated. Hatched orange boxes indicate proteins that were identified for that time point (in at least two replicates) but absent from the untreated control. An example of raw abundance measurements for panel C is given in Fig. S4. The complete set of LFQ values, ratios, and adjusted P values is provided in Data Set S2.

