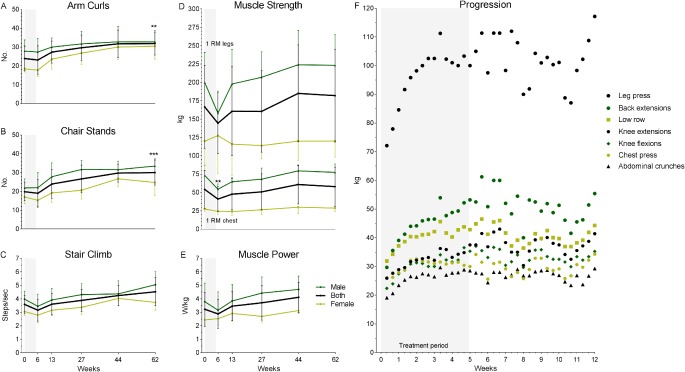
Figure 2.

Physical tests and progression. Functional performance measured by 30‐second arm curl test (A), 30‐second chair stand test (B), and stair climbing time (C). Muscle strength measured by 1RM tests in legs and chest press machines, respectively upper and lower part of graph (D), and maximal leg extension power (E). Progression of load (weight lifted) for each exercise (leg press, back extensions, low row, knee extensions, knee flexions, chest press, and abdominal crunches) during the 12‐week program (F). A‐E: Values presented as mean ± SD. Change from baseline: **p < 0.01, ***p < 0.001. Black line, both male and female. Dark green line, male. Light green line, female. F: Progression presented as mean values at each training session. Grey area shows treatment period.
