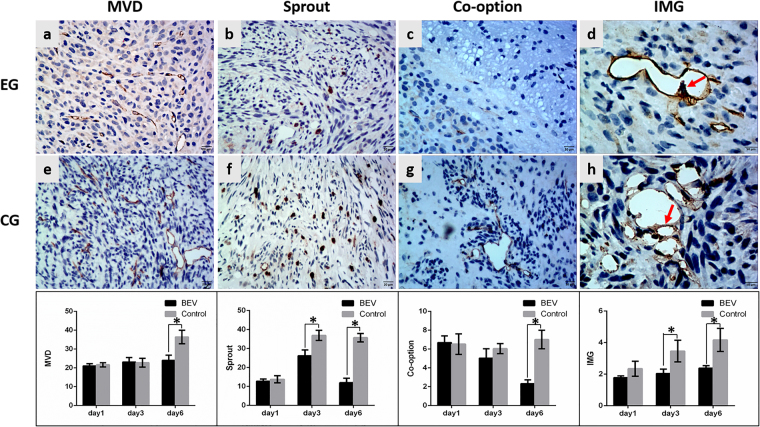
Figure 2.
The variation in neovascularization patterns after BEV administration. The histopathological images show the variation in MVD, sprouting angiogenesis, co-option and IMG at 6 days after BEV administration. Upper row, experimental group (EG), middle row, corresponding control group (CG). The lower bar graphs show the variation in corresponding neovascularization patterns after BEV administration at three time points. (a,e) CD34-positive tumor microvessel. (b,f) Tenascin-C-positive stalk representing vascular sprouting. (c,g) Tumor cells surrounding CD34-positive tubes represent vascular co-option. (d,h) CD34-positive folds across the lumens represent intussusceptive microvascular growth (red arrow). Data were represented as the means ± SD. *Indicates P < 0.05.

