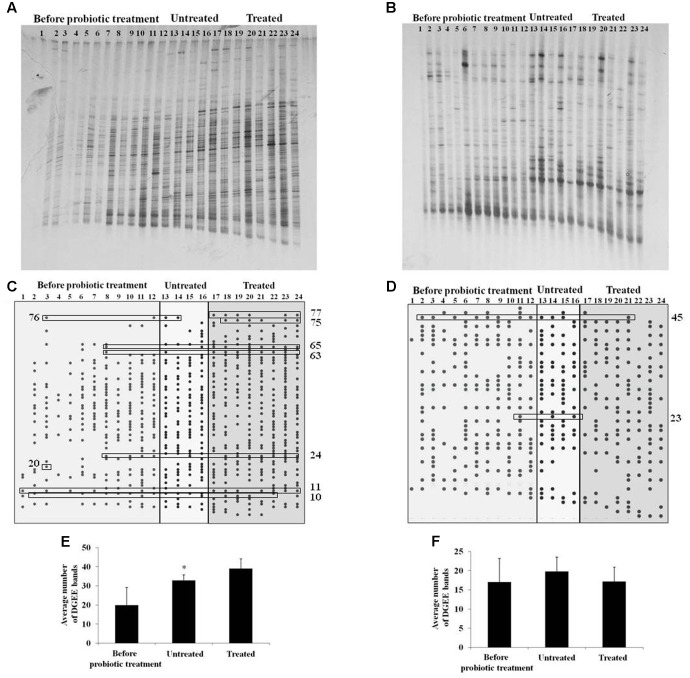
FIGURE 5.
Denaturing gradient gel electrophoresis analysis of microbiota diversity. (A,B) DGGE profiles of rDNA amplicons obtained using universal primers (A) or Lactobacillus sp.-specific primers (B) on bacterial DNA isolated from fecal samples of sows (samples 1–12) or litters (13–24) belonging to untreated (13–16) or treated sow (17–24); (C,D) Graphical presentation of DGGE bands obtained using universal primers (C) or Lactobacillus sp.-specific primers (D). The numbers on the x-axis correspond to the numbers of lanes as presented in (A,B). Statistically relevant bands given in Table 2 are presented in boxes; (E,F) The average number of DGGE bands obtained using universal primers (E) or Lactobacillus sp.-specific primers (F) in specific groups (sows before probiotic treatment, litters of untreated sows and litters of treated sows). Statistically significant values compared to the control are marked with asterisks (∗p < 0.05).

