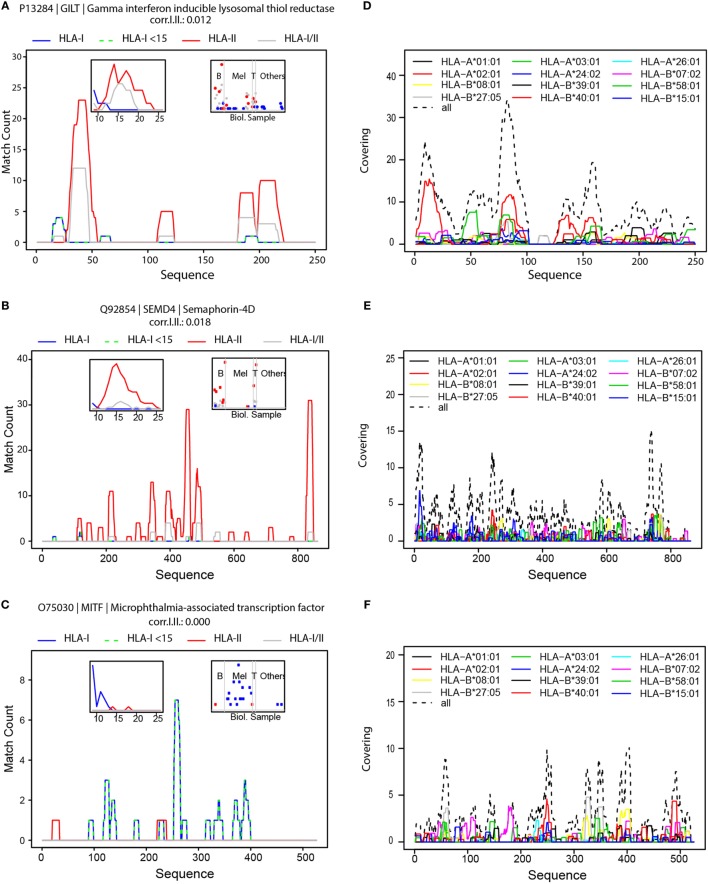
Figure 4.
Hotspots of mass spectrometry-detected HLA-I and HLA-II binding peptides and the landscape of predicted HLA-I peptides. Visualization of hotspot of HLA peptides from GILT (A), SEMD4 (B) and MITF (C); density profiles of HLA-I peptides (in blue), HLA-I peptides shorter than 15-mers (in green dashed line), HLA-II peptides (in red), and HLA-I/II peptides (in gray). The left inserts are histograms of the length of HLA-I, HLA-II and HLA-I/II peptides, and the right inserts visualize the number of peptides detected in the different samples, grouped as B-cells, Melanoma, T-cells and other samples. Visualization of the landscape of possible presentation of GILT (D) SEMD4 (E) and MITF (F) using alignment of peptide sequences predicted by NetMHCpan to bind any of the 12 HLA-I supertypes.

