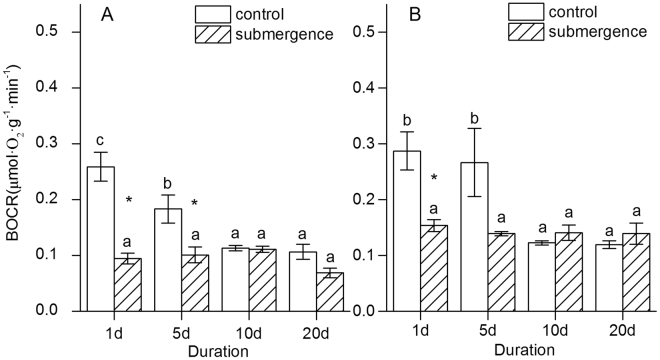
Figure 5.
Effect of flooding on the BOCRs of S. variegata and C. camphora. (A) S. variegata and (B) C. camphora. Values are mean ± standard error of mean < SE has already been defined in text > based on three independent assays from ANOVA. The BMR was evaluated from the average OCR of seedlings, which was calculated using the following formula: BOCR = Σ (OCR × biomass allocation). Different letters indicate statistical significance (P < 0.05) according to the Duncan’s test. *Indicates difference between the submerged seedlings and the control, according to the t test (P < 0.05).

