Figure 3.
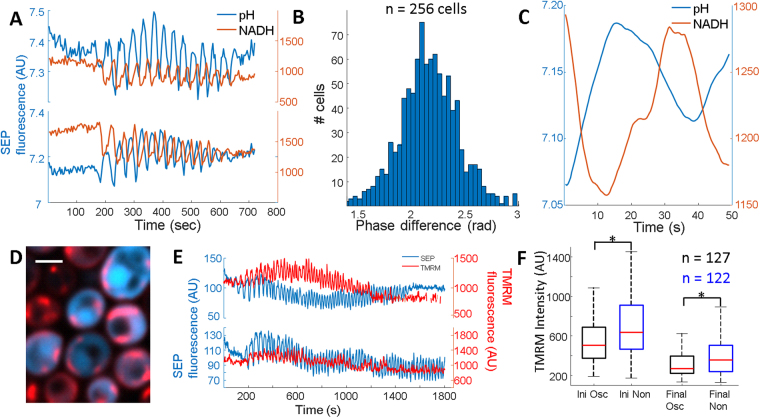
NADH and mitochondrial potential oscillate during cytoplasmic pH oscillations. (A) Time traces from 2 individual cells imaged with SEP-mRuby (pH) and NADH autofluorescence. (B) Phase difference between the pH oscillations and NADH oscillations. Each member of the histogram is the average phase difference from a single cell. (C) Average of many oscillations from a single cell in both pH (blue) and NADH (red) showing non-sinusoidal nature of the NADH autofluorescence. (D) Merged image showing cytoplasmic SEP (blue) and TMRM (red). Scale bar is 2 μm. (E) Time traces from 2 individual cells showing oscillations in pH (blue) and mitochondrial membrane potential (red). (F) Box plot of the TMRM intensity in mitochondria from oscillating (black boxes) and non-oscillating (blue boxes) cells from the same experiment before and 30 minutes after the addition of glucose. Red line indicates median, box indicates 75/25%, and black dashed lines indicate 90/10% of the maxima. Outliers were analyzed but not shown. *Represents a p value < 0.01 measured by an unpaired student t-test with unequal variance.

