Figure 4.
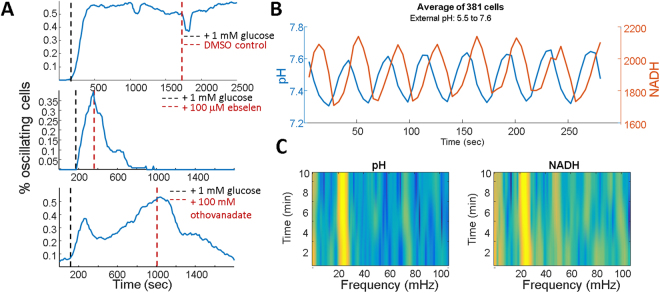
pH oscillations are necessary and sufficient to drive NADH oscillations. (A) Fraction of oscillating cells after the addition of glucose (black dashed line) a DMSO control (top), ebselen (middle) or sodium orthovandate (bottom) shown with red dashed lines. (B) Average time trace from a population of cells while recording pH and NADH measured on glass adhered cells with glucose while alternating external pH between 5.5 and 7.6 every 20 seconds. (C) Spectrograms of pH and NADH from the same experiment.

