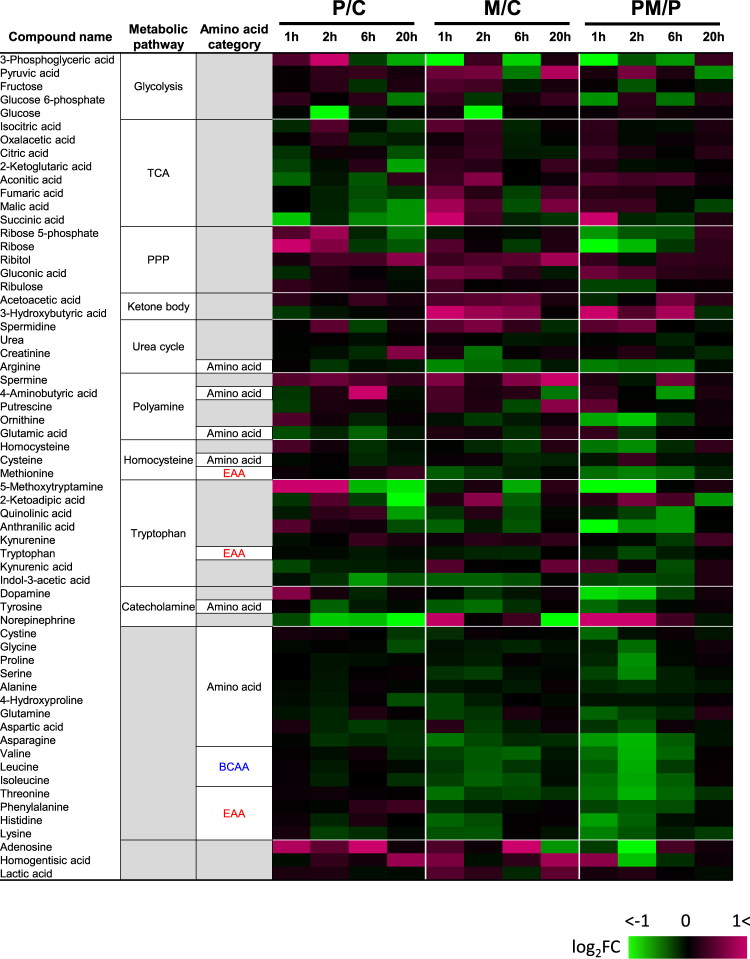
Fig. 5.
Heat map of changes in common metabolite levels in polyI:C-treated and/or maoto-treated rats. Heat map showing the fold change of each common metabolite in plasma after administration of polyI:C in control (P/C), maoto in control (M/C), and maoto in polyI:C-treated (PM/P) rats. Magenta indicates an increase in metabolite fold number or up-regulation; green indicates down-regulation of a specific metabolite versus the control (n = 6). BCAA branched-chain amino acid, EAA essential amino acid, PPP pentose phosphate pathway, TCA tricarboxylic acid

