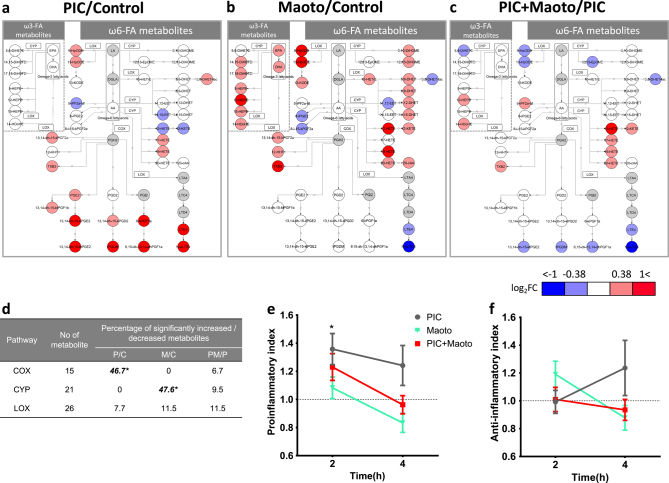
Fig. 6.
Profile of lipid mediators after administration of polyI:C and/or maoto. Comparison of fold changes of lipid mediators in plasma after administration of a polyI:C in control (PIC/Control(P/C)), b maoto in control (Maoto/Control(M/C)), and c maoto in polyI:C-treated (PIC + Maoto/PIC(PM/P)) rats, shown as metabolic pathways of lipid mediators. These pathways indicate fatty acids and lipid mediators that increased or decreased by > 0.38 or <−0.38 log fold change in response to each treatment, as well as key metabolites in the pathways. Circles indicate metabolites; undetected metabolites are colored gray. Rectangles indicate enzymes (COX, CYP and LOX) involved in metabolizing the lipid mediators. EPA and DHA are categorized as ω3 fatty acids; LA, DGLA, and AA are categorized as ω6 fatty acids. d Summary of changes in the metabolic pathways of lipid mediators. Fisher’s exact test was used to assess the effects of each treatment on lipid mediators categorized by the COX, CYP and LOX pathways (*P < 0.05). All detected lipid mediators metabolized by the COX, LOX, and CYP pathways were included in the test, and metabolites that significantly decreased or increased against each control group (P < 0.05 by Welch’s t-test) were analyzed. The metabolites in each metabolic pathway that significantly increased or decreased are listed in Supplementary Information. e Proinflammatory index and f anti-inflammatory index calculated as described by Tam et al.22 with modification. Detected lipid mediators were categorized by proinflammatory or anti-inflammatory index as described in Supplementary Information. The score of each group was normalized to the score of its own control group. Data represent mean ± SEM of the following measurements: at 2 h, Control (n = 18), Maoto (n = 17), PIC (n = 17), PIC + Maoto (n = 17); at 4 h, n = 10. *P < 0.05 versus control group by Welch’s t-test with Bonferroni correction

