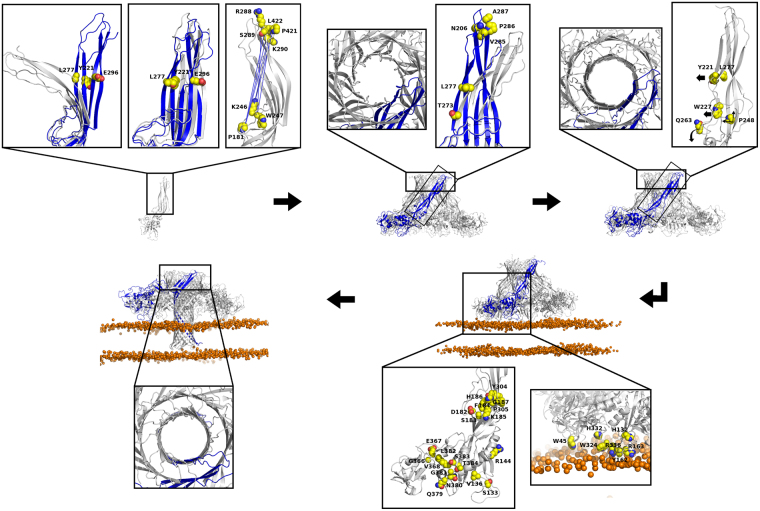
Figure 6.
New insights into the pore forming process of aerolysin-like toxins. In the figure, the main steps leading to pore formation are highlighted: soluble monomer, soluble prepore and post-prepore oligomers, membrane-interacting oligomer and pore. For each step, the close-up images show, represented by spheres, the functionally relevant residues as suggested by our results, colored according to: carbon in yellow, oxygen in red, nitrogen in blue. When needed, black arrows are stressing the motions that may be induced by those residues. On the oligomers, only one protomer is colored in blue. On the representation of the PCA motions, only one extreme conformation is colored in blue. The lipid bilayer is represented showing only the phosphate ion as an orange sphere. On the close-ups of the first step, from left to right: motions described by PC1 and PC3, and the strongest anti-correlations during the aerolysin wt MD. On the second step, the close-ups show, from left to right, a partially formed DBB on the prepore, and the motion described by PC2. In the third step, the close-ups show a more perfect DBB formed on the post-prepore, and the main residues that may be involved in the release of the stem loop and strands β2-β3 to form the TM barrel. For the fourth step, the membrane interacting residues, so as those involved on the piston-like motion, are shown from right to left. Finally, on the close-up of the pore we can see the final DBB conformation.

