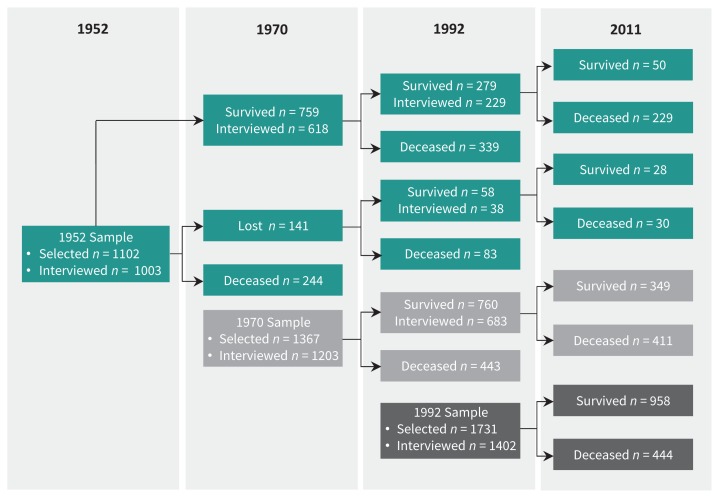
Figure 1:
Flow diagram of participants through the 3 Stirling County Study samples. The diagram depicts the number of participants selected for each sample (1952, 1970 or 1992), interviewed following selection, re-interviewed at later phases of the study, and survived through the study period that ended Dec. 31, 2011.

