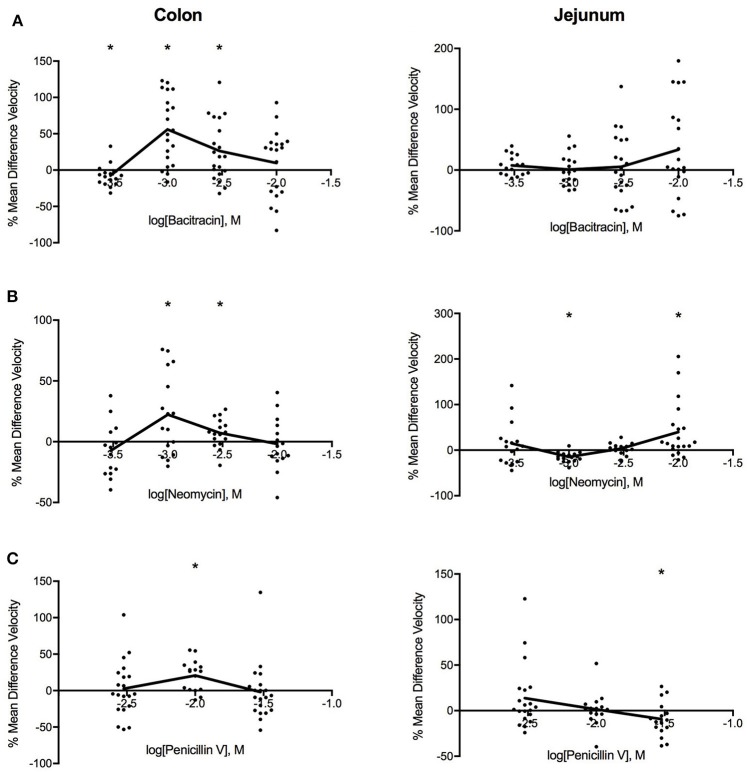
Figure 2.
Log-dose vs. response curves for the effect of (A) bacitracin (B) neomycin and (C) penicillin V on PCC velocity (mm/s) of Swiss Webster mouse colon (left) and jejunum (right). Response variable is given as the percent mean difference between control and treatment experiments (* denotes p < 0.05). Adjacent means are connected.

