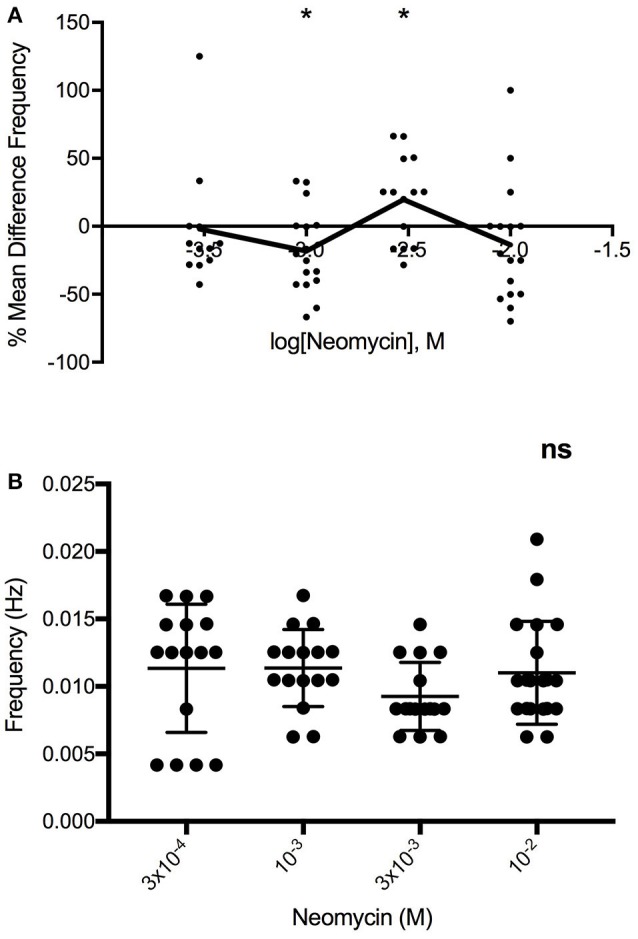
Figure 5.

(A) Multiphasic log-dose vs. response curve for the effect of 0.27, 0.91, 2.73, 9.09 mg/ml neomycin on PCC frequency (Hz) of Swiss Webster mouse jejunum, despite (B) lack of differences in baseline PCC frequency (Hz) between jejunal segments (n = 16). One-way ANOVA summary details P = 0.2989, F = 1.25, R square = 0.0554. ns, not significant.
