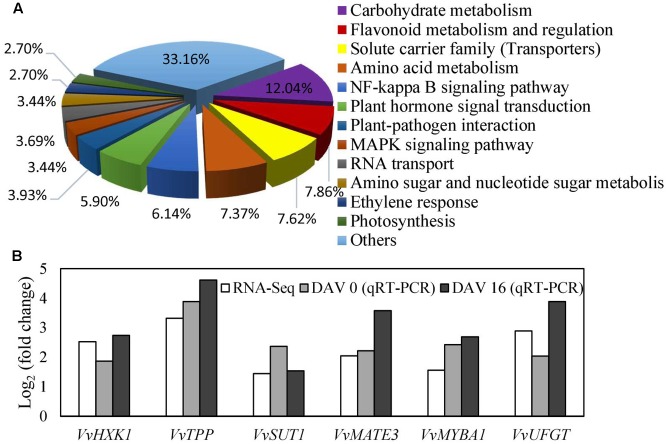
FIGURE 7.
Biological processes of differentially expressed genes classified by gene ontology (A) and the most differentially expressed genes related to sugar signaling, anthocyanin biosynthesis and transport (B). Fold changes from qRT-PCR at 0 and 16 DAV (B) were used to validate the DGE genes and to determine the expression changes of the DGE genes at different time points. Fold change from qRT-PCR was calculated by comparing the relative expression values of the selected genes in the transgenic and WT plants. Data are presented as the means of three replicates. Accession no of the genes are as follows: VvHXK1, XM_002283572; VvTPP, XP_002263078; VvMATE3, XM_002280387; VvMYBA1, AB097923; VvUFGT, AF000372.

