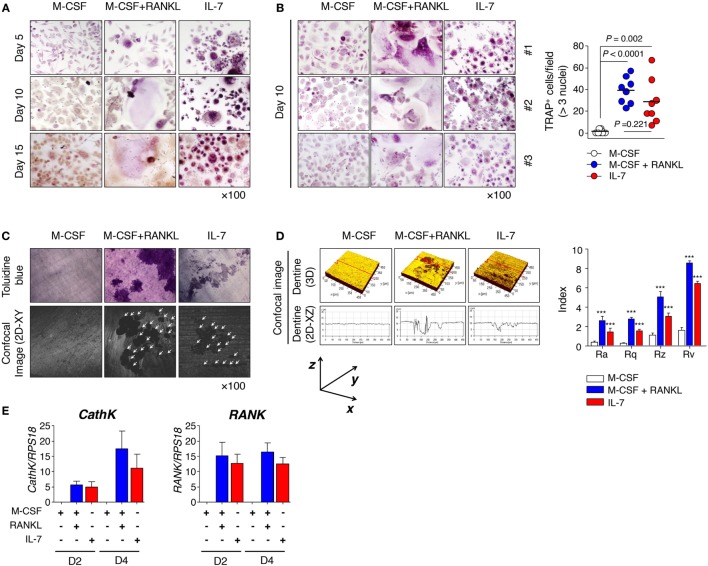
Figure 1.
Interleukin (IL)-7 induced osteoclast formation in peripheral blood mononuclear cells (PBMCs) from healthy individuals. PBMCs from healthy individuals were treated with macrophage colony-stimulating factor (M-CSF; 20 ng/mL), receptor activator of nuclear factor κB ligand (RANKL; 50 ng/mL), or IL-7 (2 ng/mL) for the indicated periods by replacing the medium at 3-day intervals with fresh cytokines. Cells were fixed and stained for tartrate-resistant acid phosphatase (TRAP). (A,B) Mature osteoclasts, which were defined as multinucleated (≥3 nuclei) TRAP+ cells, were counted manually using a light microscope. Representative images (A,B) and quantification (B) showing TRAP+ cells are shown. Results are representative of five independent experiments with eight different donors. Bars represent the mean and p values were obtained using the unpaired two-tailed Student’s t-test. (C) PBMCs were cultured for 30 days on top of dentine disks in 96-well culture plates in the presence of M-CSF (20 ng/mL), RANKL (50 ng/mL), or IL-7 (2 ng/mL). After removing adherent cells, the resorption lacunae were counterstained with toluidine blue. Photographs were taken through a confocal microscope and the area of resorption pits was measured in four randomly selected areas for each dentine slice. Representative toluidine blue image (upper panel) and confocal image (lower panel) are shown. Data are representative of three independent experiments (n = 3). The arrowhead indicates a resorption pit. (D) Roughness parameters [roughness average (Ra) calculated over the entire measured length or area, statistical moments of peak distribution (symmetry, Rq), mean roughness depth (Rz), and maximum profile valley depth (Rv)] and the number of pits are indicated. The graph represents the mean ± SEM and p-values were obtained using two-way analysis of variance followed by Bonferroni post hoc test. ***p < 0.001, vs. the control group. (E) PBMCs were cultured for the indicated number of days with M-CSF (20 ng/mL), RANKL (50 ng/mL), or IL-7 (2 ng/mL). Then, quantitative RT-PCR of cathepsin K (CathK) and RANK was performed and the data was normalized to ribosomal protein S18 (RPS18). The graph represents the mean ± SEM (n = 9).

