Figure 3.
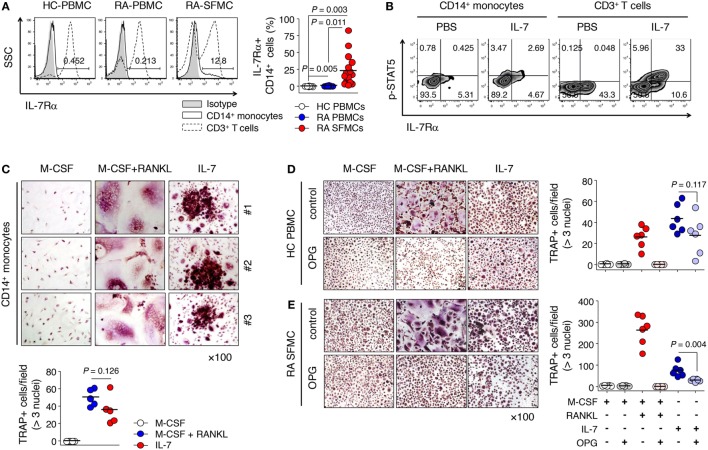
Interleukin (IL)-7 induced osteoclast formation from IL-7 receptor α (IL-7Rα)+ monocytes. (A) Cells were stained with antibodies (Abs) for CD3, CD14, and IL-7Rα expression was measured by flow cytometry. Representative histograms of IL-7Rα expression in CD14+ monocytes and CD3+ T cells (left panel) and the graph showing the frequencies of IL-7Rα expressing CD14+ monocytes [right panel, healthy (HC) peripheral blood mononuclear cells (PBMCs), n = 11, rheumatoid arthritis (RA) PBMCs, n = 8, RA synovial fluid mononuclear cells, n = 17]. Results are representative of six independent experiments with 8–17 different donors. Bars represent the mean and p-values were obtained using the unpaired two-tailed Student’s t-test. (B) Cells were stained with Abs for CD3, CD14, IL-7Rα, and fixable viability dye, then stained with Abs for p-signal transducer and activator of transcription 5 (p-STAT5) after incubation with IL-7 (10 ng/mL) or PBS for 30 min. Representative histogram of p-STAT5 and IL-7Rα. (C) CD14+ monocytes from patients with RA were cultured with M-CSF (20 ng/mL), RANKL (50 ng/mL), or IL-7 (2 ng/mL) for 10 days, replacing the medium at 3-day intervals with fresh cytokines. Tartrate-resistant acid phosphatase (TRAP) staining and enumeration were performed as described in Figure 1. Representative images and quantification of TRAP+ cells are shown. Results are representative of six independent experiments with six different donors. Bars represent the mean and p values were obtained using the unpaired two-tailed Student’s t-test. (D,E) PBMCs from healthy individuals (D) and SFMCs from RA patients (E) were cultured with M-CSF (20 ng/mL), RANKL (50 ng/mL), or IL-7 (2 ng/mL) in the presence or absence of osteoprotegerin (OPG; 100 ng/mL) for 10 days, replacing the medium at 3-day intervals with fresh cytokines and osteoprotegerin (OPG). TRAP staining and enumeration were performed as described in Figure 1. Representative images and quantification of TRAP+ cells are shown. Results are representative of six independent experiments with six different donors. Bars represent the mean and p values were obtained using the unpaired two-tailed Student’s t-test.

