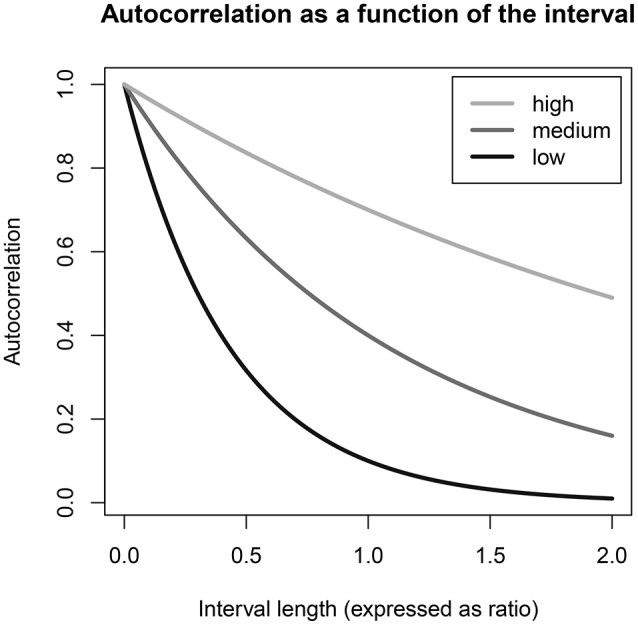
Figure 2.

The relationship of the autocorrelation to the (proportionate) interval length Δ, given by ϕ raised to the power of Δ, is illustrated here for cases where the autocorrelation for a one-block interval is 0.1, 0.4, or 0.7, labeled as low, medium, and high ϕ parameters, respectively. The interval length is expressed as a ratio of the block length chosen in the study design, such that an interval of 0.5 is half a block and 2.0 is two blocks; and the depicted relationship holds regardless of what amount of time (e.g., 60 or 120 min) is considered to be “one block.” When the autocorrelation for a one-block interval is low to medium, shorter and longer time intervals in an empirical data set cannot be expected to cancel each other out exactly in the estimation of ϕ.
