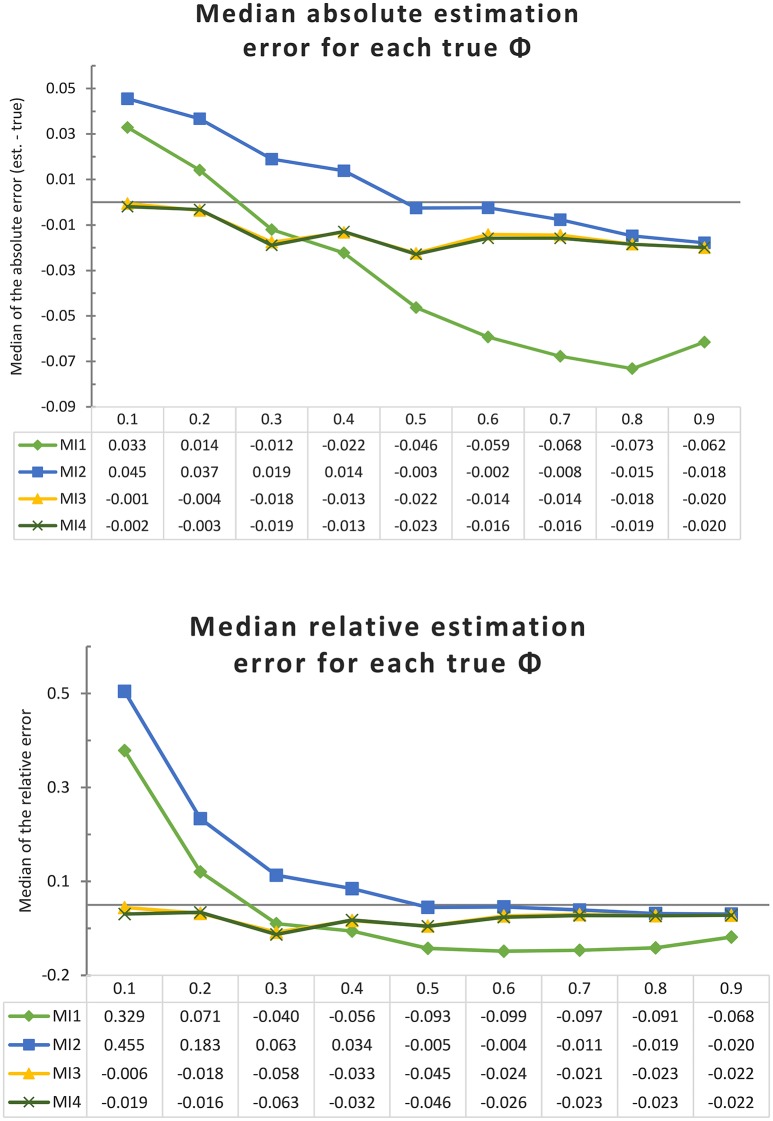
Figure 5.
Median absolute and relative estimation error, for each model implementation and true ϕ, over 1,000 shorter univariate time series (of 10 days each), with no minimum interval length. Each line represents a model implementation, and on the X-axis we have the nine different true values of ϕ.

