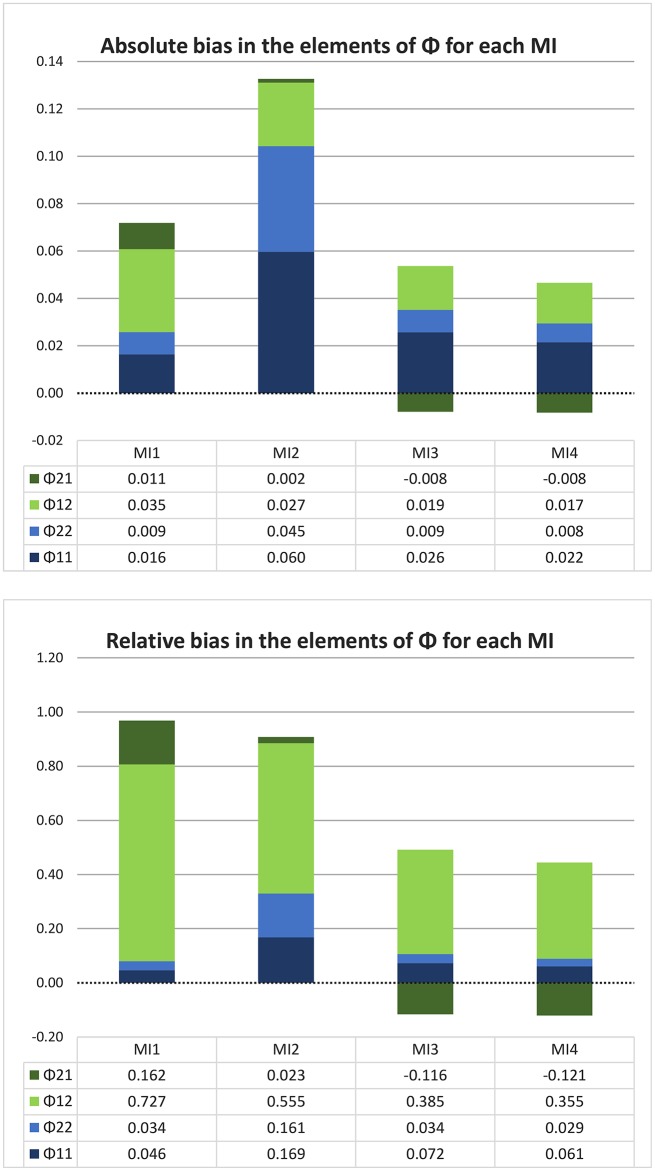
Figure 6.
Absolute and relative bias in Φ for each model implementation in the bivariate simulation with one very long time series (1,000 days) and no minimum interval length. In this graph, each stacked bar represents a model implementation and each color represents a different element of the matrix Φ, with the autocorrelations in blue and the cross-coefficients in green. It can be seen that MI 1 and 2 have a greater total amount of bias (longer bars) than MI 3 and 4, and that only the latter two model implementations have any negative bias (namely, for ϕ21). MI 2 stands out particularly because of its large positive bias in both of the autocorrelations.

