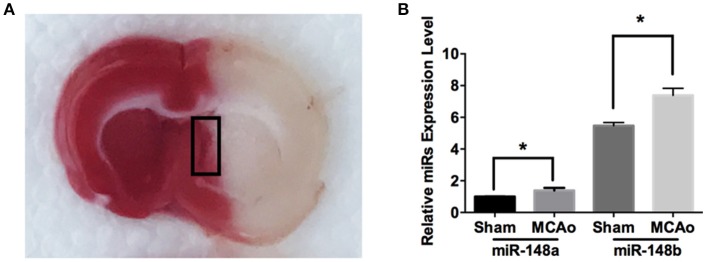
Figure 1.
miR-148a/b expression levels changed after MCAo. (A) Image of TTC staining of rat brain section after MCAo. SVZ (marked with black rectangle) in ischemic hemisphere and the corresponding area from sham group rats were isolated respectively for qRT-PCR test; (B) miR-148a/b expression levels were measured in sham and MCAo rat SVZ area. Mean ± SE, *p < 0.05, n = 3/group.

