Figure 4.
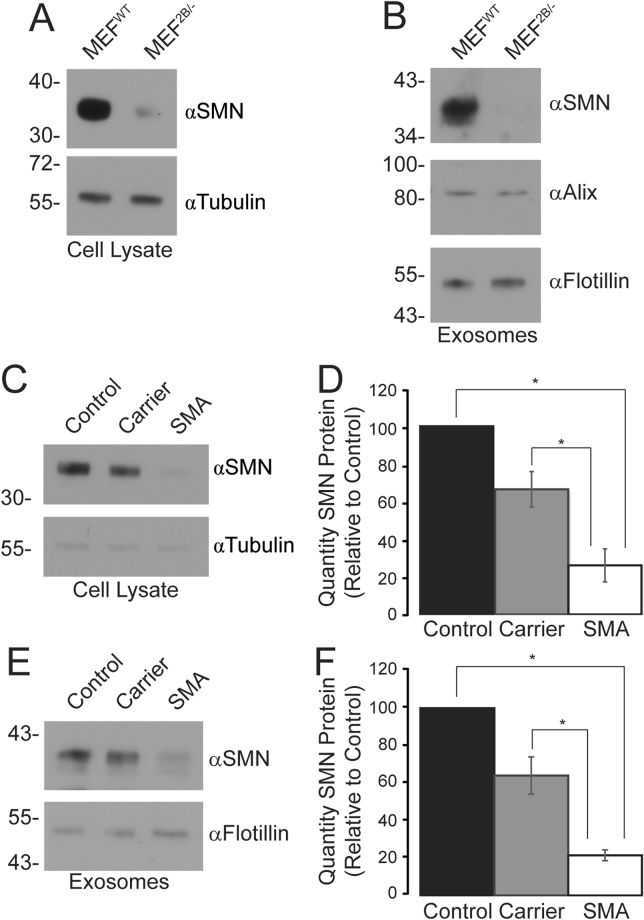
The quantity of SMN protein in exosomes reflects the intracellular levels in fibroblasts derived from a mouse model of SMA and patients with type I SMA. Panel A: Crude protein cell lysates (5 µg) from MEFs derived from wildtype mice (MEFWT) or Smn 2B/− mice (MEF2B/−), a mouse model of SMA, were analysed by immunoblot for SMN and tubulin (loading control). Data is representative of n = 3. Panel B: Exosomes were isolated from the medium of MEFWT and MEF2B/−, 3 µg of the resulting samples were separated by SDS-PAGE and analysed by immunoblot for SMN, Alix, and flotillin (loading control). Data is representative of n = 3. Panel C: Crude protein cell lysates (5 µg) from normal, SMA carrier or SMA type I human fibroblasts were analysed by immunoblot for SMN and tubulin (loading control). Data is representative of n = 3, and is quantified in Panel D. Asterisks (*) indicates significant differences between groups, determined by Bonferroni post-hoc analysis (p < 0.05). Panel E: Exosomes were isolated from the medium of normal, carrier or SMA type I fibroblasts, 3 µg of the resulting samples were separated by SDS-PAGE and analysed by immunoblot for SMN, Alix, and flotillin (loading controls). Data is representative of n = 3, and is quantified in Panel F. Asterisks (*) indicates significant differences between groups, determined by Bonferroni post-hoc analysis (p < 0.05).

