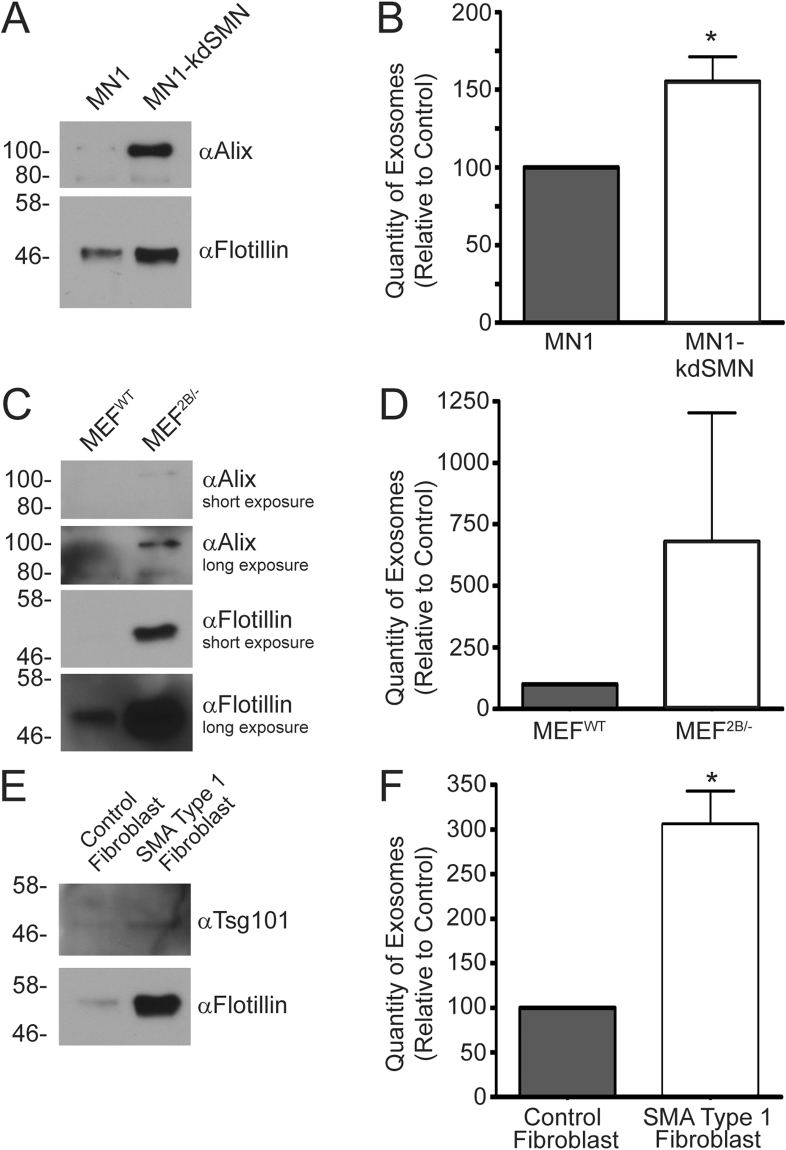
Figure 5.
Tissue culture models of SMA show enhanced levels of exosomes in the medium. Exosomes were isolated from control (MN1, MEFWT, normal control human fibroblasts) and SMN protein-depleted cell culture models (MN1-kdSMN, MEF2B/− and SMA type I fibroblasts) using Exoquick. Panels A, C and E: Equivalent volumes of the isolated exosomes were separated by SDS-PAGE and analyzed by immunoblot for SMN, or exosome markers Alix, flotillin, or Tsg101. Panels B, D, and F: The concentration of exosomes in the samples was determined by nanoparticle tracking analysis. Data is representative of n = 3–4, and is presented as average particle concentration and standard deviation, normalized to the control for each cell type. An asterisk (*) indicates p < 0.05. Statistical analysis was performed using an unpaired Student’s t-test. Exosomes were isolated from cells grown in medium supplemented with microvesicle-depleted FBS.

