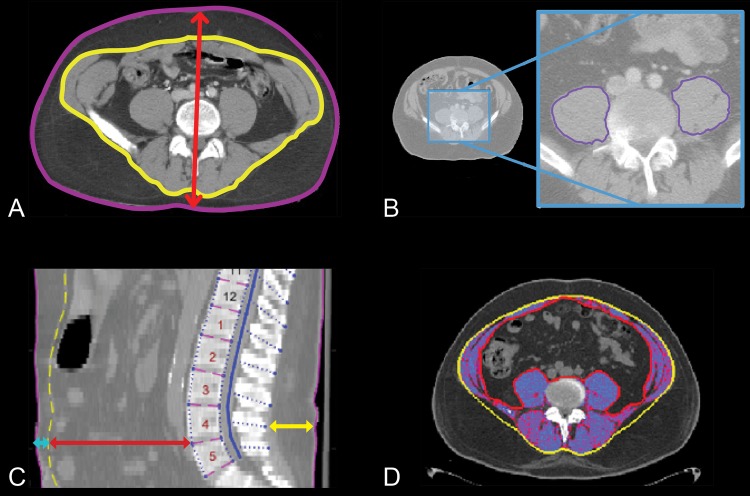
FIG 1.
Representative images of key morphomic parameters that include (A) body depth (red arrow), fascia area (yellow border), total body area (purple border), and subcutaneous fat area (area between purple and yellow borders); (B) total psoas area (sum of left and right areas within purple border); (C) spinous process to back skin (yellow line), vertebral body to fascia (red line), and fascia to front skin (turquoise line); (D) skeletal muscle area (shaded region represents muscle tissue within the fascial boundary).

