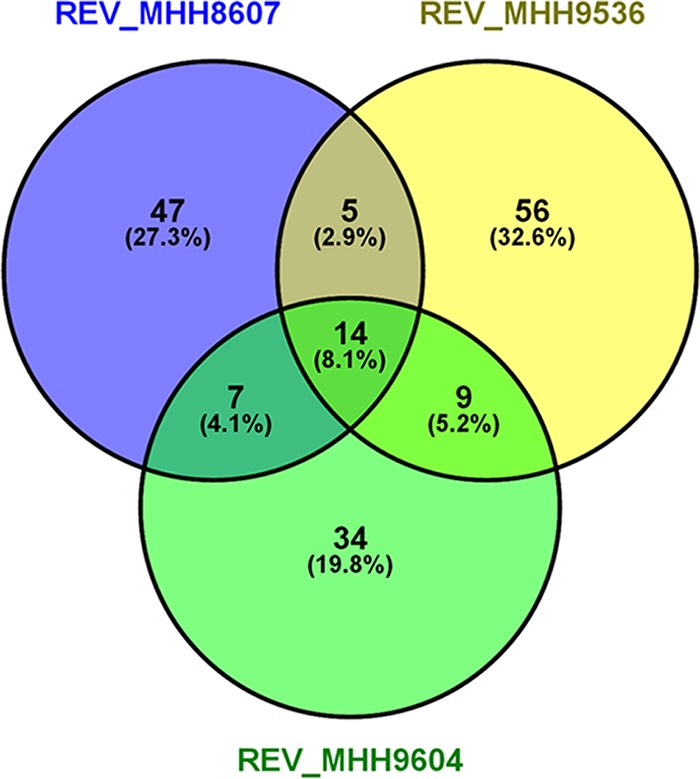
FIG 2.

Differentially expressed genes in the SCV isolates in comparison with their respective revertants. A gene was categorized as differentially expressed when the absolute log2-fold change was ≥2 and the P value was ≤0.01. The Venn diagram shown was created with VENNY (60).
