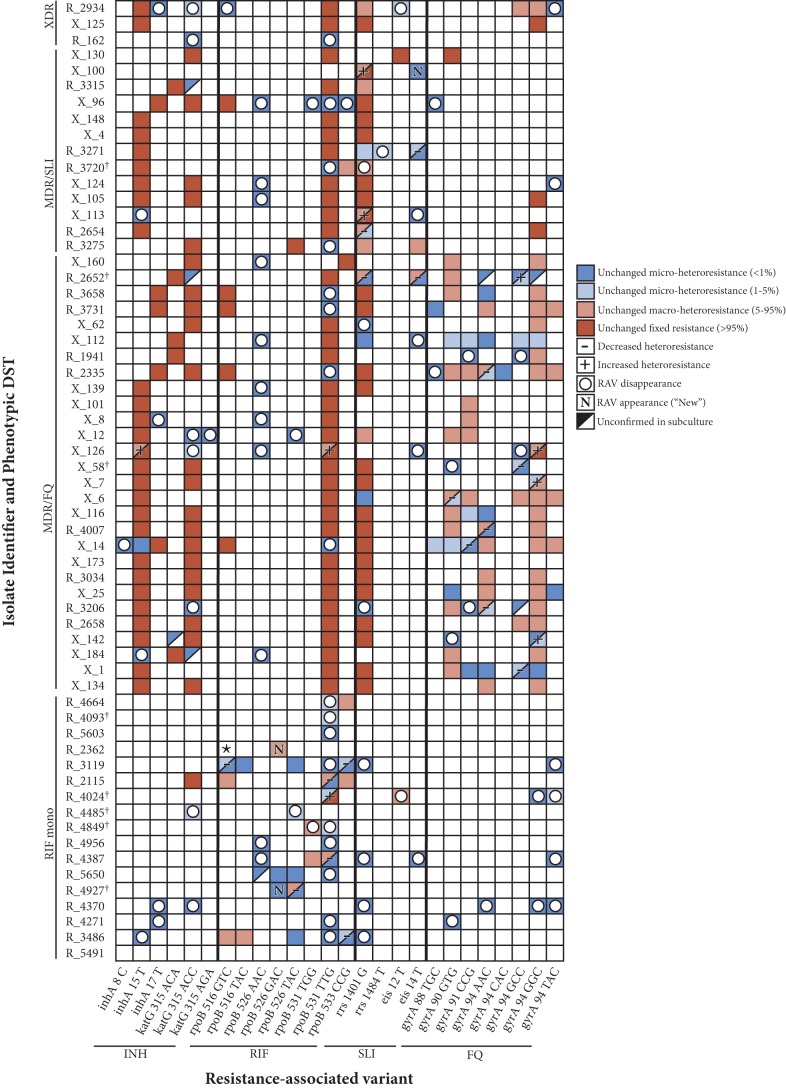
FIG 2.
Dynamic changes in heteroresistant M. tuberculosis profiles with serial subculture. The color-coded map illustrates the overall loss of M. tuberculosis resistance-associated variant (RAV) subpopulations (empty circles or “−” label), while some RAVs (e.g., gyrA 94GGC) appear to be selected for in subculture (“N” or “+” label). Red boxes indicate fixed-resistance mutations (≥95% of the total M. tuberculosis population) in both samples (cultures 2 and 5); salmon-colored boxes indicate macroheteroresistance (5% to 95% of the total M. tuberculosis population) in both samples; light blue boxes indicate microheteroresistance (<5% of the total M. tuberculosis population) in both samples; dark blue boxes indicate microheteroresistance (<1% of the total M. tuberculosis population) in both samples. Also illustrated is RAV disappearance (empty circles, with the background color illustrating the subpopulation size in the original culture), appearance (“New”), and categorical decline or growth (− or +, respectively). Please note that data corresponding to growth or decline within categories (e.g., R_3206 gyrA 90GTG increasing from 25% to 44%, with both samples being “macroheteroresistant”) are not shown. Sample R_5491 was demonstrated to be wild type at all RDRs analyzed. ★, all early reads for sample R_2362 identified the 9-bp deletion at rpoB 516–525 in the original culture, though in subculture this deletion was strongly offset by a minority strain harboring the rpoB 526GAC mutation (please see Discussion for details). †, isolates transitioning from resistant to susceptible for at least one drug. XDR, extensively drug resistant (MDR, with additional resistance to both FQ and SLI).

